Introduction
Nonprofit board members carry fiduciary responsibility for their organization's financial health — yet most arrive at the boardroom without deep accounting backgrounds. Financial dashboards have become the primary tool that converts raw financial data into clear, governance-ready information boards can actually act on.
The problem is that dashboards only work when board members know what to look for and how to act on what they see. 36% of nonprofits ended 2024 with an operating deficit — the highest level in 10 years — and 74% of nonprofit leaders deal with cash-flow problems at least occasionally.
Many boards receive dashboards but never use them to their full governance potential.
This guide explains how nonprofit board members specifically use financial dashboards to monitor KPIs — from preparation before meetings to decisions made in the room and follow-up accountability between meetings.
Key Takeaways
- Nonprofit boards monitor 5-8 strategic KPIs per meeting, not every line item — the dashboard replaces static reports, not the conversation
- Three prerequisites matter: clean data, KPIs aligned to mission, and a financial leader who contextualizes what the numbers mean
- Board members review dashboards before meetings, then use the live view to drill into questions as they arise
- Key categories include liquidity, financial sustainability, program efficiency, and budget performance — resist tracking more than 10-15 indicators
- When a KPI crosses a threshold, the board asks "why" and holds management accountable — not solves the problem directly
Why Nonprofit Boards Use Financial Dashboards for KPI Monitoring
Traditional financial reports — static PDFs and spreadsheet exports — are backward-looking and require time-consuming interpretation. The average nonprofit financial close takes 19 days, meaning boards often make decisions based on data that's 3-5 weeks old and formatted for accountants, not governors.
Nonprofit boards carry fiduciary responsibility for financial health. According to BoardSource, that duty requires members to "exercise reasonable care in all decision-making" and act as "trustees of the organization's assets" — meaning stale reports aren't just inconvenient, they're a governance risk.
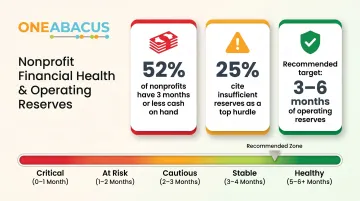
The stakes are concrete: 52% of nonprofits have 3 months or less of cash on hand. Real-time visibility gives boards the window to catch warning signs before a cash shortfall becomes a full crisis.
That urgency shapes how dashboards are built — because boards and finance teams need fundamentally different views of the same data:
- Boards use dashboards to ask strategic questions and hold leadership accountable
- Finance teams use dashboards to manage day-to-day operations and prepare board reports
- Board-facing dashboards emphasize trends, exceptions, and strategic metrics
- CFO-facing dashboards include operational detail and transactional data
Getting this distinction right is what separates a dashboard that drives governance from one that collects dust before the next board meeting.
What Boards Need Before Using a Financial Dashboard Effectively
Three prerequisites must exist before a board can use a dashboard effectively:
Live data integration — Without a connection to QuickBooks, NetSuite, Blackbaud, or a similar platform, the dashboard is only as current as the last manual export. That lag introduces error risk and erodes the board's confidence in what they're seeing.
Collaboratively defined KPIs — Boards that inherit a dashboard without participating in KPI selection often ignore it. The metrics don't map to their governance questions. Effective dashboards come from a shared process: boards surface the strategic questions they need answered, and finance leadership translates those into measurable indicators.
A financial interpreter — A CFO, controller, or fractional CFO who can explain variances and translate data into language non-financial board members can act on. 72% of nonprofits struggle with finance function turnover, and the average time to fill an open role is 5 months.
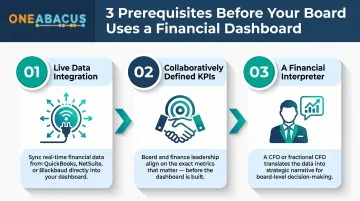
For nonprofits without a full-time CFO, One Abacus Advisory fills that interpreter role — analyzing dashboard data, flagging variances, and presenting findings in a format boards can act on.
At the Philadelphia Zoo, for instance, One Abacus optimized the NetSuite environment to strengthen reporting capabilities and operational efficiency. The result was greater board confidence in financial results during a critical leadership transition.
How Nonprofit Board Members Use Financial Dashboards Step by Step
The board's effective use of a financial dashboard follows a three-phase rhythm tied to the board meeting cycle: preparation before, engagement during, and accountability after. Skipping any phase reduces the dashboard from a governance tool to a compliance artifact.
Before the Board Meeting: Pre-Review and Threshold Scanning
Board members should receive dashboard access 48-72 hours before a meeting, not in the meeting itself. The pre-meeting window is when each member scans for KPIs that have crossed a defined threshold or show unusual trends, so questions arrive prepared rather than reactive.
The most common pre-meeting errors:
- Skipping pre-review entirely, which produces superficial discussion during the meeting
- Diving too deep into operational detail, which pulls the board into management territory
Dashboards work best when boards focus on exceptions, not explanations. A board member reviewing a dashboard before the meeting should be asking: "Which metrics are off track?" and "What questions do I need management to answer?" — not trying to solve variance issues independently.
During the Meeting: Live Review and Strategic Discussion
The dashboard functions as the shared frame of reference during the financial portion of a board meeting. The CFO or finance staff member walks through 3-5 KPIs that require attention, using the live dashboard to show trends, compare actuals to budget, and identify where the organization is on or off course.
The board's role during review is strategic, not operational:
- Governance question: "If reserves are below our 3-month target, what is management's plan to rebuild them?"
- Operations question: "Why did we overspend on line item 47?"
The first question belongs in the boardroom. The second belongs in a management meeting.
Indicators that confirm effective dashboard use:
- Discussion focuses on 2-3 priority issues rather than reviewing every metric
- Decisions or directives are documented for follow-up
- The board is not hearing financial news for the first time in the meeting
Brady Martz identifies "blurring the line between governance and management" as the #1 governance pitfall, and weak financial oversight as #2. The live dashboard review is where boards either respect or violate that boundary.
After the Meeting: Accountability and Follow-Through
Maintaining that governance boundary doesn't stop when the meeting ends. Boards use dashboard data to create accountability between cycles by:
- Assigning specific KPI targets to management
- Setting threshold alerts for the next review cycle
- Ensuring items flagged in the meeting appear on the next meeting's dashboard agenda
Updating KPIs as priorities evolve is equally important. A board that tracks the same 8 metrics year after year — without asking whether those metrics still reflect mission priorities — risks governing backward, reacting to last year's concerns instead of this year's strategic direction. Reviewing which KPIs to carry forward should be a standing agenda item at least once annually.
Key Financial KPIs Nonprofit Boards Should Monitor
Boards should resist the temptation to track everything. The most effective nonprofit board dashboards contain 10-15 indicators maximum, organized into 3-4 strategic categories rather than a flat list of metrics.
Liquidity and Financial Stability
Months of operating reserves is the single most important liquidity metric for boards. It answers: "How long can the organization operate if all incoming revenue stopped?"
Unlike raw cash balances, months of reserves contextualizes liquidity relative to the organization's actual spending rate. Candid recommends 3-6 months of expenses as a commonly used reserve goal, though each nonprofit should determine the appropriate level based on its own risk profile and revenue volatility.
Other key liquidity indicators:
- Current ratio: Current assets divided by current liabilities (measures short-term financial health)
- Working capital position: Current assets minus current liabilities (shows cushion available for operations)
52% of nonprofits have 3 months or less of cash on hand, and 25% of nonprofit leaders rank insufficient operating reserves as a top financial hurdle. Those numbers make liquidity monitoring non-negotiable for any board.
Revenue Health and Diversification
Boards should monitor:
- Revenue mix: Percentage from individual donations, grants, earned income, events
- Revenue growth rate: Tracked over time to identify trends
- Concentration risk: Whether any single revenue source represents an outsized portion of total revenue
Financially healthy nonprofits typically ensure no single revenue stream exceeds 25-30% of total revenue. Concentration above 30% is considered high risk.
The urgency is real: 84% of nonprofits with government funding expect cuts to that funding source, and overall donor retention fell to 42.9% in 2024 — the fifth consecutive year of decline. Organizations with concentrated revenue have little room to absorb those shocks.
Expense Efficiency and Program Investment
Two metrics evaluate whether resources are deployed in mission-aligned ways.
The program expense ratio measures what percentage of total expenses goes directly to programs. The BBB Wise Giving Alliance standard is at least 65%, though best practice now recognizes that "right-sized" overhead enabling strong governance and technology is often a sign of organizational health, not waste.
The 2013 "Overhead Myth" letter — signed by GuideStar, Charity Navigator, and BBB Wise Giving Alliance leaders — argued that overemphasis on overhead ratios creates a "Starvation Cycle," leaving nonprofits without the infrastructure they need to succeed.
Context matters when reading these numbers.
Program expense ratio benchmarks:
- 65-75% is considered strong
- Ratios above 85% may signal underinvestment in infrastructure
- Administrative expense ratio: 10-25%
Budget Variance and Forecast Accuracy
Boards use the budget vs. actuals view to evaluate management's forecasting accuracy over time, not just whether the current period is on track.
Key practices for board oversight of variance:
- Target threshold: Within +/-5% of budget
- Watch for patterns: Repeated variances in the same direction signal a forecasting discipline issue, even when financial outcomes are acceptable
- Require narrative: Ask management to explain variances that exceed threshold — not just report the number
- Act on insights: Use variance trends to adjust spending or fundraising strategies before year-end
Best Practices for Board Members Reading Financial Dashboards
Three habits separate boards that get real value from their dashboards from those who simply review them.
Read the dashboard before the staff memo. Board members who read the prepared commentary first anchor their entire review to staff interpretation. Reading the dashboard independently first means significant trends are less likely to get filtered before they reach the board's attention.
Document threshold policies for each KPI. For example: "If months of operating reserves falls below 2.5 months, this item is automatically elevated to a board discussion — regardless of the agenda." Written thresholds remove subjective judgment about what's worth raising and create a consistent governance standard.
Apply the 5-second rule. A well-designed dashboard should communicate its most important insight within 5 seconds of viewing. That means leading with status indicators (on track / at risk / off track) and using visual hierarchy so critical KPIs are visible without scrolling or decoding raw numbers.

These practices are most effective when boards have the financial literacy to act on what the dashboard shows — not just acknowledge it. One Abacus Advisory works with nonprofit boards as a fractional CFO partner to build that foundation: establishing threshold policies, clarifying what each KPI signals, and ensuring financial oversight extends beyond the quarterly meeting.
Frequently Asked Questions
What should a financial dashboard include?
A nonprofit financial dashboard should cover four categories: liquidity (months of reserves, current ratio), revenue health (diversification, growth rate), expense efficiency (program expense ratio, overhead rate), and budget performance (variance tracking). Aim for 10–15 indicators that would change a governance decision when they cross a threshold — not a comprehensive accounting report.
What is the 5 second rule for dashboards?
The 5-second rule holds that a well-designed dashboard should communicate its most important insight within 5 seconds of viewing. For board dashboards, this means leading with status indicators (on track / at risk / off track) and using visual hierarchy so critical KPIs are immediately visible without scrolling or interpreting raw numbers.
How to look up a nonprofit's financials?
Nonprofit financial information is publicly accessible through IRS Form 990 filings, available on databases like ProPublica's Nonprofit Explorer or GuideStar (Candid). These documents show revenue, expenses, net assets, and executive compensation, though they are backward-looking annual snapshots rather than the real-time view a financial dashboard provides.
What KPIs should a nonprofit board monitor on a financial dashboard?
Boards should focus on 5-8 strategic KPIs per meeting cycle: months of operating reserves, budget variance (revenue and expenses), program expense ratio, revenue diversification, and fundraising ROI. These cover the financial health, mission alignment, and sustainability questions appropriate for governance-level oversight.
How often should nonprofit board members review financial dashboards?
Boards typically review dashboards at each meeting — quarterly is common. Finance and audit committee members should go further: ongoing access and monthly review of key liquidity and budget metrics is advisable, especially during periods of financial stress or major programmatic change.
How is a board financial dashboard different from a financial report?
A financial report is a static, backward-looking document presenting detailed transactional data for a specific period. A dashboard is a dynamic view that tracks trends, flags exceptions, and supports governance questions in real time. Put simply: the report tells you what happened; the dashboard tells you where you stand and what to watch.