Introduction
Every month, nonprofit leaders and board members receive financial statements — balance sheets, income statements, perhaps a variance report. Yet for many, translating those numbers into actionable decisions remains frustratingly difficult. Without a traditional profit/loss framework to lean on, how do you know whether your organization is on solid ground or sliding toward trouble?
Nonprofit financial ratios are built for exactly that problem. These tools convert raw financial data into meaningful signals — answering the questions that keep leaders up at night: Can we make payroll if a major grant falls through? Are we spending enough on programs to satisfy donors and watchdog groups?
Are we building reserves or slowly depleting them?
This article explores three essential categories of nonprofit financial ratios: liquidity (can we survive short-term disruptions?), mission efficiency (are resources reaching programs?), and sustainability (are we building long-term resilience?). Each category answers a distinct question about organizational health — and together, they give leaders a complete picture of where their nonprofit actually stands.
Key Takeaways
- Nonprofit financial ratios fall into three categories: liquidity, efficiency, and sustainability
- Tracking ratios as three-to-five-year trends — not snapshots — reveals whether your financial health is improving or eroding
- The program expense ratio (65–80% target) is most closely watched by donors and watchdogs
- Days cash on hand and operating reserve ratio (three to six months target) signal whether your organization can weather funding gaps or unexpected shortfalls
- Accurate expense classification is the foundation — without it, no ratio gives you a true picture
What Are Nonprofit Financial Ratios?
Nonprofit financial ratios are quantitative expressions of the relationship between two financial figures, designed to reveal the health, efficiency, and resilience of an organization in a single comparable value. Unlike for-profit businesses that rely on profitability metrics like return on equity, nonprofits need ratios that measure sustainability, stewardship, and how effectively dollars reach programs — and that's exactly what nonprofit-specific ratios are built to do.
Ratios add value in two primary ways:
- Trend analysis — Tracking your own ratios over three to five years reveals improving or deteriorating patterns
- Benchmarking — Comparing your ratios against peer organizations of similar size and mission using publicly available Form 990 data
No universal target applies to every nonprofit. A startup arts organization will naturally show different ratios than an established food bank. What matters is whether your ratios are moving in the right direction — and whether you understand why.
Where the Data Comes From
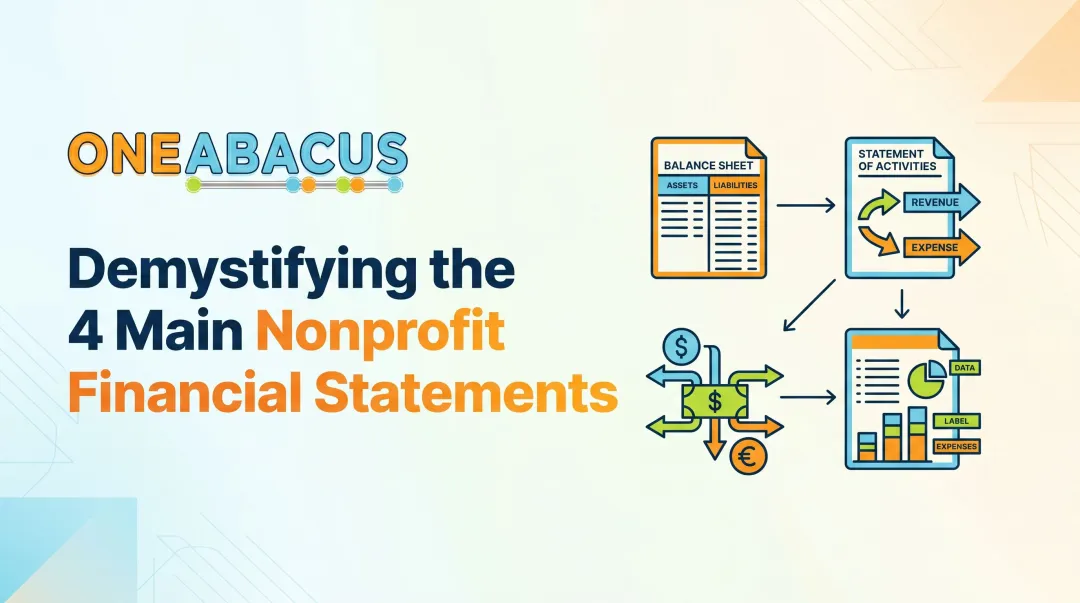
The underlying data for ratio calculations comes from four primary financial statements required under FASB ASC 958:
- Statement of Financial Position (balance sheet)
- Statement of Activities (income statement equivalent)
- Statement of Functional Expenses (program vs. administrative vs. fundraising breakdown)
- Statement of Cash Flows
Accurate expense classification across those three cost categories — program, administrative, and fundraising — is what makes ratio analysis trustworthy. When classifications shift based on who enters invoices rather than a written policy, the ratios lose their meaning entirely.
The Key Nonprofit Financial Ratios Explained
Liquidity Ratios: Can You Cover the Next Three to Six Months?
Liquidity ratios answer one urgent question: Does your organization have enough cash to keep operating if revenue stops or gets delayed?
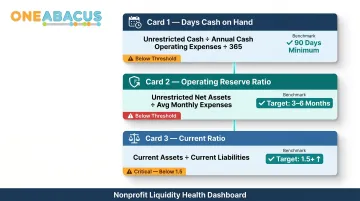
Days Cash on Hand
- Formula: Unrestricted cash ÷ (annual cash operating expenses ÷ 365)
- Excludes depreciation, which requires no cash outlay
- Benchmark: 90 days (three months) minimum; organizations dependent on government grants or single funders should aim higher due to payment delays
- Reality check: According to the NFF 2025 State of the Nonprofit Sector Survey, 52% of nonprofits have three months or less of cash on hand, and 18% have one month or less
Operating Reserve Ratio
- Formula: Unrestricted net assets ÷ average monthly operating expenses
- Target range: Three to six months
- Below three months signals vulnerability; fewer than 30 days means almost no buffer for disruptions
Current Ratio
- Formula: Current assets ÷ current liabilities
- Target: 1.0 minimum, with 1.5 or higher providing a meaningful buffer
- Critical nuance: Restricted funds in current assets may not be available for general operating obligations
- Finance teams should confirm how much of current assets are genuinely unrestricted before presenting this ratio to the board
A ratio below 1.0 means short-term obligations exceed what the organization can readily access, which warrants immediate attention.
Mission Efficiency Ratios: Are Resources Reaching Your Programs?
Mission efficiency ratios measure how well an organization allocates resources toward its core mission versus overhead and fundraising.
Program Expense Ratio
- Formula: Program service expenses ÷ total expenses
- Benchmarks: BBB Wise Giving Alliance sets a 65% minimum; Charity Navigator cites 70% for top-rated organizations
- The overhead myth: A ratio above 90% can signal underinvestment in infrastructure, technology, and staff
- In their 2013 open letter, GuideStar, Charity Navigator, and BBB Wise Giving Alliance urged donors to reject the idea that financial ratios are a proxy for overall nonprofit performance
- Board guidance: Set a target range and review trends over time — a single year's ratio rarely tells the full story
Fundraising Efficiency Ratio
- Formula: Total contributions ÷ fundraising expenses
- Benchmark: 5.0 or higher (raises $5 for every $1 spent)
- Higher is better, but startup fundraising programs naturally show lower ratios
Administrative Expense Ratio
- Formula: Administrative expenses ÷ total expenses
- General benchmark: Below 35%
- Note: Charity Navigator removed this from its scoring in 2023 in recognition of the overhead myth, though many individual donors still use it
Sustainability Ratios: Is the Organization Building Long-Term Resilience?
Sustainability ratios reveal whether your nonprofit is on track for long-term viability or slowly eroding its financial foundation.
Operating Margin (Net Margin Ratio)
- Formula: (Total revenue - total expenses) ÷ total revenue
- Common misconception: Nonprofits should not run a surplus
- Reality: A small, consistent positive margin (0% to +5%) is how organizations build reserves, retire debt, invest in technology, and weather downturns
- Persistent deficits erode net assets and threaten operational continuity
- The NFF 2025 Survey found that 36% of nonprofits reported an operating deficit in 2024 — the highest in 10 years
Revenue Concentration Ratio
- Formula: Revenue from largest single source ÷ total revenue
- Risk threshold: Concentration above 30% from any single funder (government contract, foundation, major donor, or program fee client) represents material risk
- Why it matters: This metric rarely appears on standard watchdog checklists, yet it's one of the most practically important for board oversight
Spreading revenue across individual donations, grants, program fees, and earned income consistently strengthens long-term sustainability. Recent research confirms that diversification effectively lowers revenue volatility under normal conditions.

How to Use Nonprofit Financial Ratios Effectively
Track Trends, Not Snapshots
Present ratios across at least three to five years so the board can distinguish a single anomalous year from a structural change. A one-year deficit looks very different in the context of four surrounding positive years than it does in isolation.
Best practice: Financial reports provided to the governing board should always include multi-year ratio history.
Benchmark Against Peers
Form 990 data — publicly available through the IRS and platforms like ProPublica's Nonprofit Explorer — makes it possible to calculate ratios for five to ten peer organizations of similar size and mission.
Key factors for comparison:
- Geographic location (affects cost-sensitive items like real estate and utilities)
- Budget size and staff count
- Program model and service delivery approach
- Trade associations and regional nonprofit networks can help identify appropriate peers
Address the Overhead Myth Head-On
The pressure to minimize administrative and fundraising ratios has led some organizations to underinvest in infrastructure, talent, and technology — with the result that they become less effective at delivering their mission. Research consistently finds that adequate overhead investment correlates with stronger organizational performance.
Boards should use ratios as diagnostics, not as targets to be gamed.
Connect Ratios to Board Governance and Financial Policy
Boards that set written financial policy targets get more out of ratio tracking. Common examples include:
- Maintain a minimum of three months of operating reserves
- Keep the program expense ratio above 70%
- Flag any single revenue source exceeding 30% for review
Ratios without follow-through accomplish nothing. BoardSource recommends that boards exclude financial statements from consent agendas to ensure active review and discussion. A fractional CFO can help translate these ratios into a board-ready dashboard — and facilitate the policy conversation that gives them teeth.
Ensure Data Quality
Ratios are only as trustworthy as the books behind them. Essential internal controls include:
- Proper expense classification between program, administrative, and fundraising
- Monthly bank reconciliations
- Segregation of duties
- Consistent coding policies
When expense classification is inconsistent or reconciliations lag, even well-designed ratios will mislead rather than inform.
Putting It Into Practice: Reading Your Ratios Like a CFO
Example: When Two Ratios Tell a Bigger Story
Consider a mid-size nonprofit that presents its board with five years of ratio data and discovers:
- Days cash on hand dropped from 110 days to 58 days over three years
- Revenue concentration ratio rose from 22% to 41% — both driven by a single growing government contract
Neither number alone triggers alarm, but together they signal a compounding risk: the organization is growing more dependent on a single funder while its cash cushion erodes. That combination should trigger a board conversation about diversification strategy — not reactive decision-making based on either number in isolation.

Context Changes Everything
The example above works precisely because the ratios were read together, in context. No ratio means much without it.
- A food bank with significant donated inventory has much lower cash needs than a mental health services nonprofit with predictable program fee revenue
- A startup organization in its first two years will naturally show a lower program expense ratio than one operating for a decade
- Always pair ratio trends with a short narrative explaining what changed and why — this is what separates useful reporting from raw numbers
Understanding context also helps you avoid the most common pitfalls in ratio analysis.
Common Mistakes to Avoid
Don't:
- Treat a single year's data as definitive
- Compare against benchmarks from organizations with fundamentally different missions or funding models
- Chase a favorable program expense ratio by misclassifying costs
- Track ratios without connecting them to explicit policy targets or follow-up actions
How One Abacus Advisory Can Help
One Abacus Advisory serves as a fractional CFO partner that helps nonprofits move from compliance-focused financial reporting to strategic financial intelligence. Lorin Port and the One Abacus team work directly with nonprofit leaders and boards to:
- Select the right set of ratios for each organization's specific mission and funding model
- Build multi-year trend dashboards with clear visual metrics
- Establish written financial policies aligned with governance best practices
- Interpret results in board meetings using language that non-finance board members can act on
Most nonprofits don't have the internal bandwidth to produce this kind of analysis consistently. That's where fractional CFO support makes a practical difference. One Abacus brings:
- Nonprofit-focused expertise — not generic accounting services adapted for the sector
- Scalable engagements sized to fit your organization's actual needs and budget
- A track record with complex organizations, including San Diego Food Bank, Philadelphia Zoo, and Laguna Playhouse

During a leadership transition at the Philadelphia Zoo, One Abacus optimized their NetSuite environment, improved month-end close processes, and built more transparent board reporting that gave leadership clearer confidence in the numbers at a critical moment.
Frequently Asked Questions
What are good financial ratios for nonprofits?
The most universally applicable ratios are days cash on hand, operating reserve ratio, program expense ratio, fundraising efficiency, operating margin, and revenue concentration. No single set applies to every organization, but Charity Navigator and the BBB Wise Giving Alliance cite common starting benchmarks of three to six months of reserves and 65–70%+ program expenses.
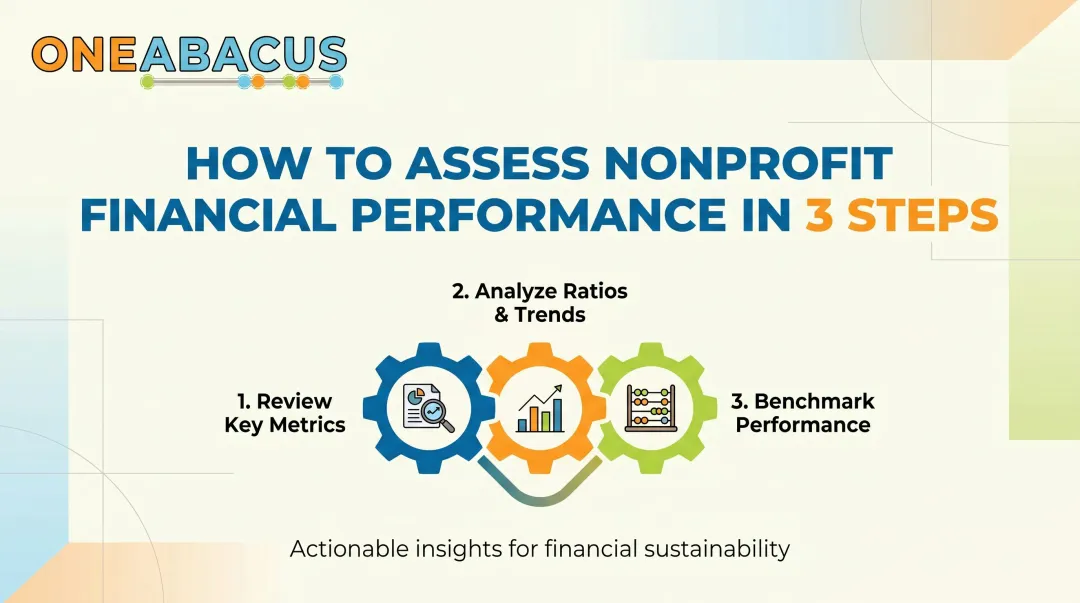
How to assess nonprofit financial performance?
Financial performance is best assessed by combining ratio analysis with trend data over three to five years and benchmarking against peer organizations using Form 990 data. Connect the numbers to board-approved financial policy targets rather than relying on any single metric or snapshot.
What are the four basic financial statements for a nonprofit?
The four required statements are the Statement of Financial Position, Statement of Activities, Statement of Functional Expenses, and Statement of Cash Flows. The Statement of Functional Expenses — which breaks down program, administrative, and fundraising costs — is the primary source for calculating spending and efficiency ratios.
What is a financial review in a non-profit organization?
A financial review is an independent CPA engagement providing limited assurance on financial statements — less rigorous than a full audit. Funders and grant agreements typically specify whether a review, audit, or compilation is required based on revenue size; the BBB Wise Giving Alliance requires audits for organizations with gross income over $1,000,000.
What is a good program expense ratio for a nonprofit?
The BBB Wise Giving Alliance sets a 65% minimum threshold, and Charity Navigator cites 70% as a general benchmark for top-rated organizations. Context matters — a newer nonprofit or one scaling rapidly may run lower temporarily. Ratios above 90% can sometimes signal underinvestment in the infrastructure needed to sustain the mission.
How often should a nonprofit board review financial ratios?
Present key ratios alongside standard financial statements at every board meeting (typically quarterly), showing at least three years of trend data. Conduct a more comprehensive peer benchmarking review annually as part of the budget or strategic planning cycle. BoardSource recommends excluding financial statements from consent agendas to ensure meaningful discussion.