Introduction
Financial warning signs in nonprofits rarely announce themselves. By the time board members notice a problem, reserves are already gone and programs are at risk. According to the Nonprofit Finance Fund's 2025 State of the Nonprofit Sector Survey, 18% of nonprofits hold less than one month of operating reserves, and 52% hold less than three months—leaving most organizations one disruption away from a crisis.
This guide gives nonprofit leaders, board members, and funders a practical framework for financial evaluation. You'll know which documents to request, which metrics reveal real organizational health, and how to benchmark your findings against sector standards—so you can make decisions with confidence, not guesswork.
Key Takeaways
- Financial evaluation assesses liquidity, expense efficiency, revenue reliability, and debt—not just revenue
- Start with Form 990, audited statements, and restricted vs. unrestricted net asset breakdowns
- Key ratios: program expense (70%+), cash reserves (3-6 months), leverage (under 30-50%), fundraising efficiency (under $0.20 per dollar)
- Compare at least three years of data — single-year snapshots miss trends that signal financial risk or stability
- Use your findings to benchmark against peer organizations and identify where leadership or financial oversight gaps exist
What Does It Mean to Financially Evaluate a Nonprofit?
Nonprofit financial evaluation is the structured process of examining an organization's financial documents, ratios, and trends to determine whether it can sustain its mission, meet obligations, and deploy resources efficiently.
Unlike for-profit business valuation, nonprofits are assessed on financial resilience, responsible use of donor dollars, and whether spending actually advances the mission. Tools like Charity Navigator and GuideStar apply this framework externally, assigning ratings based on financial health and transparency.
Two primary audiences rely on this framework:
- Internal leaders (boards, executive directors, CFOs) use it to manage, plan, and strengthen operations
- External stakeholders (donors, funders, grantmakers) use it to make informed giving and investment decisions
Which audience you represent shapes how you approach the evaluation. Internal leaders work from full financial records, while external evaluators rely on public disclosures like Form 990s and audited statements.
Why Nonprofit Financial Evaluation Matters
Financial evaluation is the foundation of good stewardship. Leaders who understand their financial picture make better decisions about staffing, programming, and risk. Those who lack this clarity often discover problems too late.
Donor and Funder Confidence
Financial transparency directly impacts donor trust. Research published in Nature (2025) found that financial transparency strongly predicts donor trust (beta = 0.35) and organizational performance (beta = 0.632). Organizations with clear, accessible financial data—including high Charity Navigator ratings or GuideStar Seals of Transparency—are better positioned to attract and retain funding.
Regulatory Compliance
Ongoing evaluation ensures your organization stays on solid legal and operational footing. The Nonprofit Finance Fund's 2025 survey found that 36% of nonprofits operated with deficits—a 10-year high—making continuous financial monitoring a necessity, not a best practice.
Key compliance areas that require regular review include:
- IRS Form 990 accuracy and timely filing
- Proper tracking and reporting of restricted funds
- Deficit identification before it triggers audit risk or board-level concern
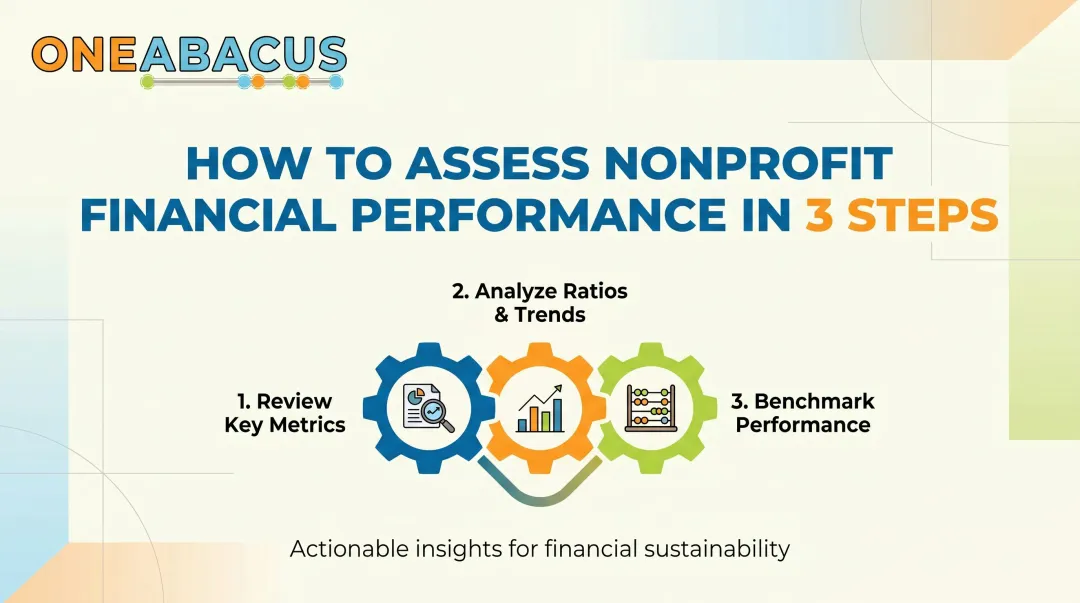
How to Financially Evaluate a Nonprofit: Step-by-Step
This six-step process applies whether you're evaluating your own organization or assessing one from the outside. Each step builds on the last—skipping steps leads to incomplete conclusions.
Step 1 – Pull the Right Financial Documents
Core documents required:
- IRS Form 990 — Publicly available via ProPublica Nonprofit Explorer or GuideStar
- Audited financial statements — Statement of Financial Position, Statement of Activities, Statement of Cash Flows, and notes
- Internal budget-to-actual reports — For internal evaluators
Form 990 is the starting point for external evaluators, offering a standardized view of revenue, expenses, assets, and governance. Internal leaders need to go further—monthly financials and a breakdown of restricted versus unrestricted net assets reveal the operational flexibility that Form 990 alone won't show.
Step 2 – Assess Revenue Composition and Reliability
Map revenue sources and calculate percentages:
- Government grants
- Individual donations
- Earned income
- Corporate support
- Foundation grants
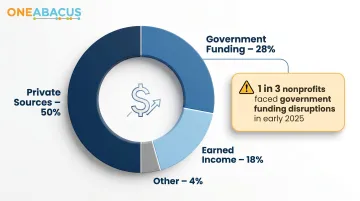
According to the Urban Institute's October 2025 data, nonprofits derive approximately 50% of revenue from private sources, 28% from government, and 18% from earned income. Heavy reliance on any single source—especially government funding—is a vulnerability. The Urban Institute also reported that one-third of nonprofits experienced government funding disruptions in early 2025, with 29% of affected organizations reducing staff.
Assess revenue reliability:
- Is revenue growing, flat, or declining over 3-5 years?
- Are revenue sources diversifying or concentrating?
- What percentage comes from recurring versus one-time sources?
Step 3 – Review Liquidity and Operating Reserves
Calculate operating reserves:
Divide unrestricted cash and liquid investments by average monthly operating expenses (excluding depreciation). The benchmark is 3-6 months of reserves, though the National Council of Nonprofits notes that no universal standard exists—context matters.
The critical distinction:
An organization may appear cash-rich while having little flexibility because funds are restricted. Leaders must understand what portion of reserves they can actually use for operations.
Step 4 – Evaluate Expense Efficiency
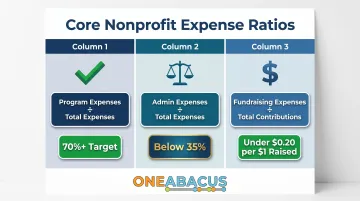
Three core expense ratios:
Program Expense Ratio = Program expenses ÷ Total expenses
- Benchmark: 70%+ (Charity Navigator gives full credit at 70%)
Administrative Expense Ratio = Admin expenses ÷ Total expenses
- General guide: Below 35%
Fundraising Efficiency Ratio = Fundraising expenses ÷ Total contributions
- Benchmark: Under $0.20 per dollar raised
Address the overhead myth:
In 2013, GuideStar, Charity Navigator, and BBB Wise Giving Alliance jointly issued a letter urging donors to stop focusing exclusively on overhead ratios. Some administrative investment is necessary for organizational capacity. An organization spending 15% on administration to support strong financial controls and staff development is better positioned than one at 8% that's chronically understaffed and audit-exposed.
Step 5 – Examine Debt Levels and Financial Leverage
Calculate leverage ratio:
Total liabilities ÷ Total assets. Charity Navigator awards full credit to organizations with a leverage ratio of 0.30 or below. Ratios above 50% signal financial risk, especially if the trend is increasing.
Distinguish between liability types:
- Deferred revenue — Healthy, mission-related (grants received but not yet earned)
- Operational debt — Requires monitoring (lines of credit, accounts payable)
- Long-term obligations — Requires strategic planning (mortgages, bonds)
A nonprofit carrying deferred revenue from a multi-year grant looks very different from one carrying the same dollar amount in revolving credit. The numbers alone don't tell you which situation you're looking at—the notes to the financial statements do.
Step 6 – Identify Trends and Interpret Results
No single year tells the full story. Pull 3-5 years of data and look for direction, not just position—an organization with modest reserves that has been building them steadily is in better shape than one with higher reserves that have been declining for three years.
Convert analysis into action:
- Flag strengths: Identify metrics that are healthy and trending well—these anchor the narrative for boards, funders, and leadership.
- Isolate deteriorating indicators: Declining reserves, rising leverage, or shrinking program ratios all warrant specific attention, not just acknowledgment.
- Define interventions: Match each problem to a concrete response—reserve-building plans, revenue diversification targets, or a structured expense review—so analysis translates into decisions.
Key Metrics and Benchmarks Every Nonprofit Should Track
The following ratios — drawn from Charity Navigator, GuideStar, and nonprofit finance best practices — give you a structured framework for evaluating financial health across four key areas.
Revenue and Funding Metrics
Revenue composition tells you how dependent an organization is on any single funding source. Calculate each source as a percentage of total revenue:
- Government reliance ratio = Government grants ÷ Total revenue — above 40-50% signals concentration risk if public funding shifts
- Individual donor concentration = Top 3 donors' contributions ÷ Total donations — high concentration increases volatility
- Earned revenue ratio = Earned income ÷ Total revenue — higher ratios indicate more financial self-sufficiency
Healthy organizations diversify across at least three revenue streams over time.
Liquidity and Cash Reserve Metrics
Current Ratio = Current assets ÷ Current liabilities
- Target: Above 1.0
Cash Reserves Ratio = Unrestricted cash ÷ Average monthly expenses
- Target: 3-6 months
Accounts Receivable Turnover — Organizations experiencing slow collections may face liquidity gaps even with strong ratios on paper.
Expense Efficiency Metrics
| Metric | Formula | Benchmark |
|---|---|---|
| Program Expense Ratio | Program expenses ÷ Total expenses | 70%+ |
| Administrative Expense Ratio | Admin expenses ÷ Total expenses | Below 35% |
| Fundraising Efficiency Ratio | Fundraising expenses ÷ Total contributions | Under $0.20 per $1 |
| Net Margin Ratio | (Total revenues - Total expenses) ÷ Total revenues | Positive or stable |

Personnel Expense Ratio (total compensation ÷ total revenue) varies significantly by service type — personnel-heavy direct service organizations differ from advocacy-based nonprofits.
Debt and Leverage Metrics
Leverage Ratio = Total liabilities ÷ Total assets
- Top-rated charities: Below 30-50%
Liability composition analysis requires review of financial statement notes — distinguishing restricted revenue held as liability versus debt obligations is a distinction surface-level evaluations often miss.
How One Abacus Advisory Can Help
One Abacus Advisory works with nonprofits that are ready to move beyond occasional financial check-ins toward a consistent, board-level evaluation framework. Lorin Port and the team bring over 25 years of finance and accounting experience—with nine years dedicated exclusively to nonprofits—helping organizations build the reporting infrastructure needed to evaluate and improve financial health on an ongoing basis.
Fractional CFO Services for Nonprofits
One Abacus's fractional CFO services are specifically designed for nonprofits navigating growth, leadership transitions, or financial complexity—providing executive-level financial leadership at a right-sized cost. Services include:
- Financial oversight, budgeting, forecasting, and cash flow management
- Board-ready financial analysis supporting strategic planning and governance
- Audit preparation, internal controls, and regulatory compliance
- Mission-aligned financial strategies that enhance sustainability
The firm has partnered with organizations like the San Diego Food Bank, Philadelphia Zoo, and Laguna Playhouse during leadership transitions and periods of financial complexity—stepping in with structure and strategic direction until each organization had the foundation to move forward confidently.

NetSuite Optimization and Financial Reporting Design
Beyond CFO services, One Abacus supports NetSuite optimization and financial reporting design—helping organizations move from reactive reporting to proactive dashboards. This includes enhanced tracking of restricted versus unrestricted funds, budget-to-actual reporting, and real-time visibility into key metrics. The result: financial data that boards and leadership can actually use to make decisions, not just file away after the meeting.
Conclusion
Financially evaluating a nonprofit is an ongoing discipline, not a one-time review. Organizations that sustain their missions over the long term are the ones whose leaders consistently track the right metrics, understand the story behind the numbers, and act on what they find.
Treat financial evaluation as a leadership responsibility, not just a compliance requirement. When your organization's financial complexity exceeds internal capacity, seek expert guidance to keep your mission on solid financial footing — before small gaps become structural problems.
Frequently Asked Questions
How do you financially evaluate a nonprofit business?
Financial evaluation starts with reviewing key documents — the Form 990 and audited financial statements — then calculating ratios across liquidity, expense efficiency, revenue reliability, and debt. Reviewing trends across multiple years tells you whether the organization can sustain its mission long-term.
How to tell if a nonprofit is financially stable?
Key stability indicators include 3-6 months of operating reserves, a program expense ratio above 70%, a leverage ratio below 50%, diversified revenue sources, and a positive or stable net margin trend over multiple years.
What financial documents should I review when evaluating a nonprofit?
Start with the IRS Form 990, which is publicly available and the primary tool for external evaluators. Also review audited financial statements — including the Statement of Financial Position, Statement of Activities, and Statement of Cash Flows — along with any internal budget-to-actual reports.
What is a good program expense ratio for a nonprofit?
Charity Navigator gives full credit to organizations with a program expense ratio of 70% or higher, meaning at least 70 cents of every dollar in expenses goes directly toward mission-related programs.
How is evaluating a nonprofit financially different from evaluating a for-profit business?
For-profits are evaluated on profitability and return on investment, while nonprofits are evaluated on financial stewardship, mission efficiency, reserve adequacy, and the ability to sustain operations—not generate profit for owners.
How often should a nonprofit conduct a financial evaluation?
Finance leadership should review key metrics monthly, present a summary dashboard to the board quarterly, and conduct a full evaluation annually as part of strategic planning. Trend data should span at least three to five years.